Rate of growth in the housing market is slowing
Earlier this week the Australian Bureau of Statistics (ABS) released their Residential Property Price Indexes for the June 2017 quarter.
The data confirmed what the CoreLogic Home Value Index has already told us, the rate of growth in the housing market is slowing, particularly so in Sydney.
Click to enlarge

Over the June 2017 quarter, the ABS Index shows combined capital city dwelling prices increased by 1.9% while the CoreLogic Home Value Index showed an increase of a lower 1.6%.
As the above graph shows, the results of both indices are closely aligned. The CoreLogic data is already available to August and shows a further cooling in the rate of growth over the three months.
Given this we can expect the trend towards slower growth to hold over the September 2017 quarter. In fact, the daily movements in the CoreLogic series is suggesting Sydney values trended slightly lower over the first 20 days of September.
Click to enlarge

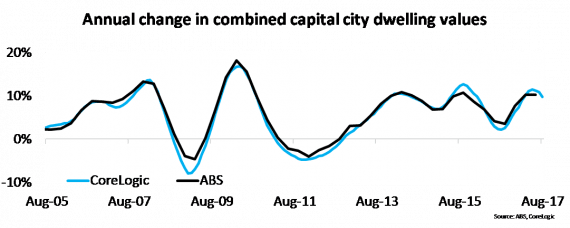
On an annual change basis both indices also indicate a slowing of the rate of growth. Over the 12 months to June 2017, the ABS reports combined capital city dwelling prices rose by 10.2% while CoreLogic data shows capital city dwelling values increasing by 11.1%. Over the 12 months to August 2017, CoreLogic data shows that dwelling value growth has slowed to 9.7% and it is expected that the ABS data once available will also show a similar slowing.
Click to enlarge

Sydney is showing clearer signs of a slowdown than other capital cities and that is evident in the above chart. Over the June quarter, the ABS showed a change of 2.3% compared to the CoreLogic series which showed a lower 1.6% change. The CoreLogic data to August shows increasing evidence of the Sydney market cooling with values having increased by a much lower 0.3%.
Click to enlarge

The annual series also show signs of softer growth in Sydney with ABS data recording a change of 13.8%, over the 12 months to June down from 14.4% in March. While the CoreLogic series recorded an annual change to June of 16.4% compared to 15.5% in March. Meanwhile, the latest data for August shows that annual growth in Sydney dwelling values has slowed to 13.0%.
Click to enlarge

The above chart shows the annual change in values across each index over the 12 months to June 2017. Despite being two different methodologies you can see that the rates of change across both metrics are quite similar. They show strong growth in Sydney, Melbourne and Hobart, reasonably strong growth in Canberra, moderate growth in Brisbane and Adelaide and ongoing declines in Perth and Darwin.
Click to enlarge

The CoreLogic Hedonic Index provides a much more timely and granular view of housing market conditions (both geographically and across product types) and the trends are interesting. It shows a substantial slowdown in growth in Sydney and a more moderate slowing in Melbourne. It indicates that growth has accelerated in Hobart and has accelerated marginally in Canberra and Brisbane.
Adelaide values are increasing at pretty much the same rate as they were in June while the declines in Perth and Darwin are greater, quite significantly so in Darwin.
Overall the data highlights the value of having a selection of indices with which to analyse the market.
It also shows how valuable more timely measures are.
When you are analysing Australia’s single largest asset class, timely insights are extremely important to allow those participants in the housing market to be able to make accurate decisions in as close to real time as possible.
It’s also a timely reminder that there is no single ‘Australian’ housing market.
While headline growth rates provide a macro-view on the market, each capital city and region of the country is showing its own unique housing market dynamic which is influenced by local demographic and economic trends as well as supply factors.
Cameron Kusher is head of research for CoreLogic. You can contact him here.
