Australians’ net wealth has nearly doubled since GFC: Roy Morgan Wealth Report
The value of assets held by Australians has almost doubled over a 12 year period, a new report has found.
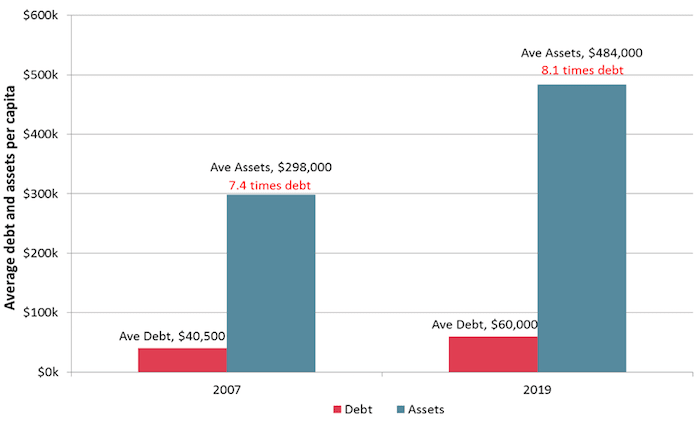
From 2007 to 2019, asset values are up 96%, while debt has increased by 78.6% over the same period, according to the Roy Morgan Wealth Report.
Over this period, which covers the period from just before the start of the global financial crisis, net wealth has increased by 98.7%.
Even after accounting for population growth and inflation, the average Australian is better off, the report said.
The report is drawn from over half a million in-depth face-to-face interviews conducted in Australians’ homes over the period from 2007 to 2019.
The second edition of the Wealth Report focuses how net wealth has changed since just before the onset of the global financial crisis.
Australia performed very strongly over the past 12 years compared with other OECD nations – particularly in Europe where many nations went backwards over the same period, it said.
Key findings of the report include:
- The value of assets held by Australians has almost doubled from 2007 to 2019 (up 96.0%). This is faster than the increase in debt of 78.6% over the same period. As a result net wealth is now 98.7% higher in 2019 than it was in 2007.
- Average per capita net wealth in real terms (adjusted for inflation), is 28.0% higher than it was in 2007 just before the onset of the global financial crisis.
- Median net worth per capita in 2007 was only $124,000, rising to $135,900, up 8.8% after allowing for inflation. The median value is a more representative metric in such a highly skewed market, as 50% are above it and 50% below, it is the central value.
- Women have improved their average net wealth position relative to men, with males now holding an average of 12.3% more wealth than women, while in 2007, they had a much higher 27.4% advantage.
- Roughly half Australia’s personal wealth continues to be held in the form of owner occupied housing (49.8%), down slightly from 51.6% in 2007, while superannuation assets make up an increasingly higher portion, rising from 19.2% to 24.4% of our wealth since 2007.
- The following chart shows that the average personal assets are now worth 8.1 times average debts, compared with 7.4 times debts in 2007.
Assets have grown faster than debt
Click here to enlarge:

Source: Roy Morgan Single Source (Australia) 12 months to March 2019, n = 51,362; 12 months to December 2007, n = 54,212. Base: Australians 14+.
"We see daily headlines about the risks posed by high levels of debt and falling property values, but when we drill down into the data, a more balanced long term picture emerges," said Michele Levine, the CEO of Roy Morgan.
"Although the last 12 months has seen a marginal decline in household net worth, it is important to understand it in the context of the long term trend. What we have seen here is a very positive long term trend.
"Housing debt has grown considerably since 2007, but not uniformly - Roy Morgan’s data shows wealthier cohorts have shown a much greater propensity to take on debt and those investors have more ability to handle downturns than more marginal borrowers in lower-wealth segments.
"A more detailed understanding of how debt and personal wealth are distributed can help dispel some of the more simplistic fears over debt, and give a more balanced view of its relationship to wealth creation in Australia over the long term."
