Assessing the effects of housing lending policy measures: RBA's Guy Debelle
EXPERT OBSERVER
Today I will summarise the Bank's assessment of the various measures put in place to address the risks around housing lending. I will draw on Chapter 5 of the recent Financial Stability Review (FSR). I think it is important in terms of accountability that we provide our assessment of the effect the measures are having and continually review whether they are achieving the desired intent.
The motivation for implementing these various measures was to address the mounting risk to household balance sheets arising from the rapid growth of certain forms of lending, in particular lending to investors and interest-only (IO) lending. The strong growth in investor borrowing was increasing the risk that investor activity could be excessively boosting housing prices and construction and so increasing the probability of a subsequent sharp unwinding. This risk is greater for investor borrowing than owner-occupiers as investors can behave pro-cyclically, withdrawing from the market as it declines. The rise in the prevalence of interest-only borrowing for both investors and owner-occupiers increased the overall risk profile of household borrowing. No principal is repaid during the IO period, and the increase in required repayments can be large when the IO period expires.
I don't see the riskiness of the borrowing as being the source of the negative shock. My concern is for its potential to be an accelerator to a negative shock from another source. To put it another way, I don't regard it as likely that household borrowing will collapse under its own weight. Rather, if a negative shock were to hit the Australian economy, particularly one that caused a sizeable rise in unemployment, then the risk on the household balance sheet would magnify the adverse effect of that shock. This would have first order consequences for the economy and hence also for monetary policy.
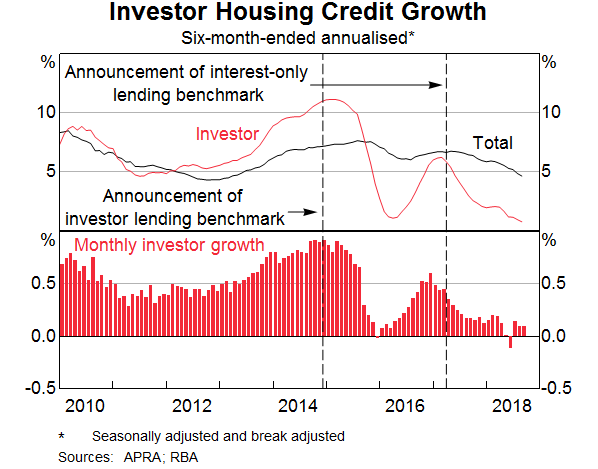
To repeat the conclusion of the assessment in the FSR: the measures have helped to reduce the riskiness of new borrowing. In turn, this has stemmed the increase in household sector vulnerabilities and improved the resilience of the economy to future shocks. The measures have led to a slowing in credit growth but there is little evidence to suggest that the measures have excessively constrained aggregate credit supply. Housing credit growth has slowed, but it is still running at 5 per cent.
The various measures implemented to address the riskiness of housing lending fall into three categories:
- Lending standards or serviceability criteria. This includes tightening up the assessment and verification of borrower income and expenses, the discouragement of high loan-to-valuation ratio (LVR) loans and ensuring that minimum interest rate buffers were being applied, including on existing loans.
- Investor lending growth benchmark. A 10 per cent cap on investor lending growth was introduced in December 2014.
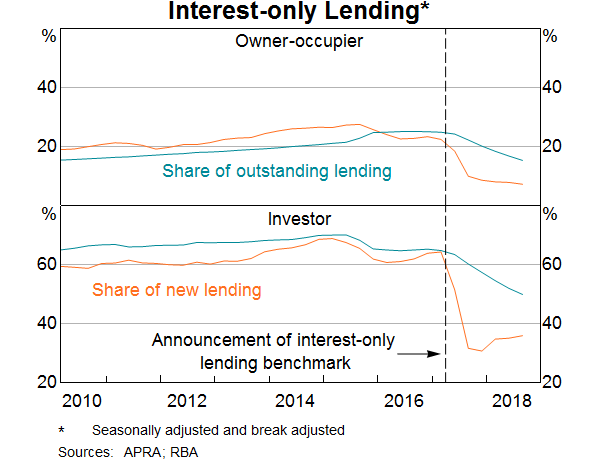
- A cap on the share of interest-only loans in new lending of no more than 30 per cent.
These measures were introduced progressively over a number of years. The scrutiny on serviceability by both APRA and ASIC has been underway for over four years now. For example, in September 2015, APRA noted that by then, serviceability practices had been tightened, such as the haircutting of various forms of income, including rental income. At the same time, APRA reported that minimum interest rate buffers and floors were also being more consistently applied.
This means that these tighter lending standards have been in place for a while now. They are not a recent phenomenon. But this also makes assessing the overall impact difficult in some cases, though the effect of some of the measures has been obvious. There clearly has also been an interaction between them.
What Has Been the Effect of These Various Measures?
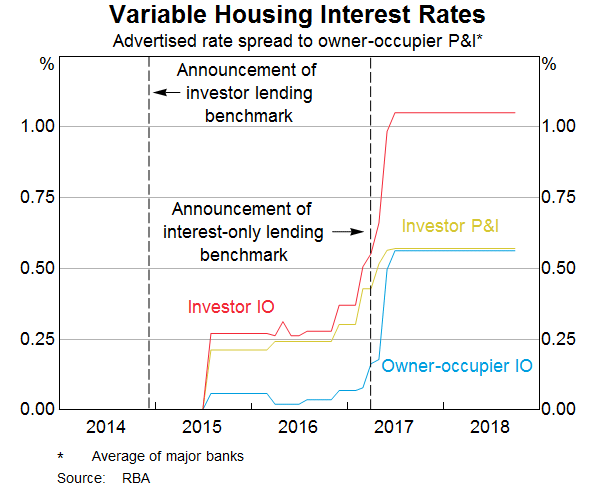
1. Different interest rates are now charged across the various types of mortgages. Interest rates are higher on investor lending and interest-only lending than they are on owner-occupier lending (Graph 1). Previously there was little, if any, variation in the interest rate charged on different types of loans, beyond the size of the discount that varied with borrower income and the size of the loan.


Competition
Turning now to look at the effect on these measures on competition. (This is covered in more detail in the FSR Chapter). The investor lending benchmark did have a competitive impact for a time in that it constrained the ability of smaller lenders to gain market share by increasing their lending faster than 10 per cent. That said, with investor lending growing at or below 5 per cent since early 2016, it has not been a significant constraint on most lenders increasing their market share for some time now. Indeed, recently we have seen smaller lenders again gaining market share. Currently the major banks' share of new lending is at its lowest in a decade. At the same time, there was no constraint on the ability of smaller lenders to gain market share in the owner-occupier market. The interest-only cap did not obviously have an effect on competition. Again, with nearly all lenders well below the 30 per cent threshold, it is not a binding constraint on lenders from increasing their market share.
The tighter lending standards have seen an increasing share of borrowers obtain finance from non-ADI lenders. These lenders are subject to regulatory oversight but less than that of ADI lenders. They are subject to ASIC's responsible lending standards but not to prudential supervision by APRA. Non-ADIs' housing lending has been growing rapidly, over twice the rate of growth of ADIs. As a result, the estimated non-ADI share of housing credit has also increased, although it remains less than 5 per cent of the total.
Effect on the Housing Market
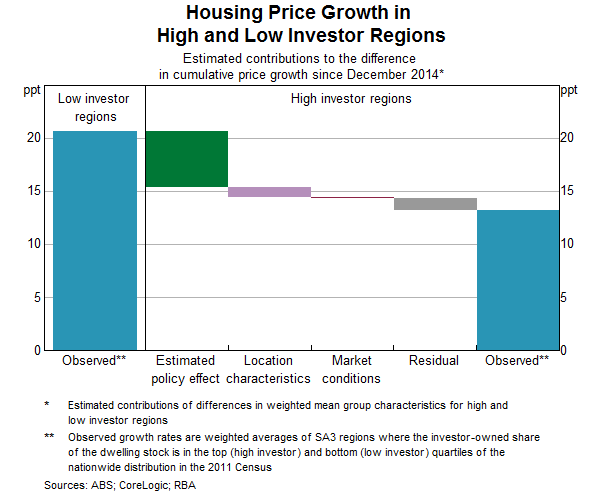
The integral relationship between debt and housing prices means that these measures have clearly influenced conditions in the housing market. The FSR analyses in detail the impact on the housing market of the investor lending benchmark in 2014. It uses the fact that the share of investors varies across different parts of the housing market. Differentiating between ‘high’ investor regions and ‘low’ investor regions, the analysis shows that high investor regions had very similar price growth to low investor regions before the benchmark was implemented. In contrast, after the benchmark was introduced, house price growth has been notably slower in the higher investor regions.
Other factors may have also contributed to the divergent price growth between the high and low investor regions. For example, regions with a high share of investors may have also experienced larger increases in housing supply and so slower price growth in the period after the benchmark was introduced. The analysis attempts to control for these other factors and concludes that the policy effect accounts for around two-thirds of the 7 percentage point difference in average cumulative housing price growth between high and low investor regions from December 2014 to mid 2018 (Graph 4).

Again it is worth reiterating that the measures are aimed at the resilience of household balance sheets, not house prices. The assessment of their effectiveness is around the riskiness of household balance sheets, not the outcomes in the housing market. But at the same time, they clearly are having a notable effect on the housing market.
Housing construction activity has been at a high level for some time now. Our forecast is for it to continue at this level for at least a year given the amount of work in the pipeline. Beyond that, we expect construction activity to decline from its peak. Off-the-plan apartment sales in the major east coast cities have declined since around mid 2017, with developers citing weaker demand from domestic investors, as well as from foreign buyers. One risk is that tighter lending standards could amplify the downturn in apartment markets if some buyers of off-the-plan apartments are unable to obtain finance. This could lead to an increase in settlement failures, further price falls and even tighter financing conditions for developers. However, to date, in our liaison with developers, few have reported much evidence of this.
While not directly related to the housing measures, there has been some tightening in credit for developers of residential property. This reflects lenders' reducing their desired exposure to dwelling construction, which is higher-risk lending, particularly given the longer planning and construction lags of higher density dwelling construction. That is, banks are less willing to lend given the fall in prices. To the extent that the housing policy measures have contributed to the decline in investor demand and prices, they have indirectly affected developers' access to finance. There is a risk that this process overshoots leading to a sharper or more protracted decline in activity than we currently expect.
The effect of a tightening in lending to developers seems to me to be a higher risk to the economic outlook than the direct effect of the tighter lending standards on households, which has ameliorated risk. Relatedly, there may also be a bigger impact on lending to small business given the extensive use of property as collateral for small business loans. This would be further exacerbated if the banks' risk appetite for small business lending declines for other reasons.
Housing prices have fallen by almost 5 per cent from their late 2017 peak while the pace of housing credit growth has slowed over the past couple of years. The fall in housing prices is a combination of a number of other factors, including the very large increase in the supply of houses and apartments both now and in prospect. It also reflects a reduction in foreign demand, which has been affected by a tightening in the ability to shift money out of China and an increase in stamp duty in some states.
Some have attributed the slowing in housing credit solely to a tightening in the supply by banks in response to regulatory actions. Others have suggested there has been a weakening in housing demand and so demand for credit, including because of the high level of and weaker outlook for housing prices. To me, reductions in both the demand and supply of credit have been at play and it is hard to separate their effects. For example, tighter lending conditions have reduced how much some people can borrow, and this contributed to weaker demand for properties and so softer prices. Price falls have themselves contributed to weaker demand by investors who are no longer confident of rising values. Assessing the relative importance of demand and supply is also complicated by the fact that banks have cut back most on their lending to less credit-worthy borrowers, but have more aggressively targeted safer borrowers with lower interest rates.
Conclusion
The regulatory measures have significantly reduced the riskiness of new housing lending. A smaller share of new loans are to investors, are interest-only, have high LVRs or are to borrowers more likely to have difficulty repaying the loan. But it takes time for the riskiness of the stock of outstanding loans to improve. When you implement a change in lending standards the existing loans are no different to how they were the day before. But over time a larger share of outstanding loans will have been written with more stringent lending standards, while the larger share of principal and interest loans will see more of the outstanding loans have a declining balance over time. Finally, in assessing the overall riskiness of the debt both before and after the various measures, it is worth remembering that arrears rates remain low.
To conclude, the available evidence suggests that the policies have meaningfully reduced vulnerabilities associated with riskier household lending and so increased the resilience of the economy to future shocks.
Guy Debelle is Deputy Governor of the Reserve Bank of Australia. He is Deputy Chair of the Reserve Bank Board and Chair of the Reserve Bank's Risk Management Committee.
