Total returns from housing are starting to ease: Cameron Kusher
GUEST OBSERVER
CoreLogic’s Accumulation Index looks at the total returns from the housing asset class factoring in the change in the value of the dwelling and the gross rental return from the property.
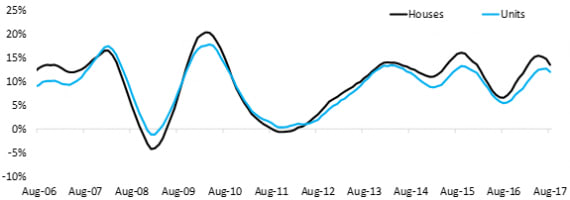
The CoreLogic Accumulation Index shows that nationally, the total returns from the housing asset class over the 12 months to August 2017 were 13.2%. Because the return is calculated from value change as well as the gross rental yield, you tend to find that houses have a superior value growth performance while units offer superior rental returns.
Over the past year, total returns for houses nationally have been recorded at 13.5% compared to a 12.0% return for units. Over the 10 years to August 2017, the annual total returns for housing nationally have been recorded at 8.8%, split between 8.9% for houses and 8.5% for units.
Annual total returns from the housing asset class, National

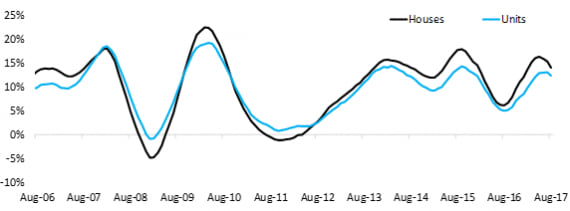
Total housing returns have generally been superior in capital cities to regional markets however, in the 2008 and 2010-11 downturns, returns slumped by a greater magnitude in the capital cities. Over the past decade, combined capital city annual total returns have been recorded at 9.3% with returns of 9.5% for houses and 9.0% for units. Over the 12 months to August 2017, total returns have been recorded at 14.0% for houses and 12.3% for units. Like the national chart, the recent data for the combined capital cities shows that total returns have started to slow.
Annual total returns from the housing asset class, combined capital cities

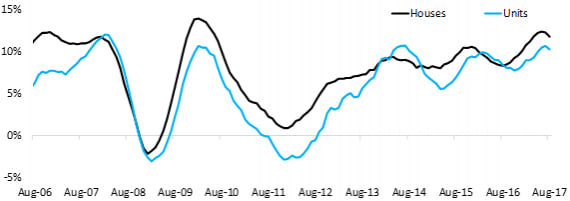
Regional markets are also beginning to see total returns slow however, the returns over recent years have generally not been as strong as those across the combined capital cities. Over the past 12 months, total returns have been recorded at 11.7% for houses and 10.2% for units. Over the past decade, annual total returns for housing outside of the capital cities have been recorded at 7.0%, 7.2% for houses and 5.6% for units.
Annual total returns from the housing asset class, combined regional markets

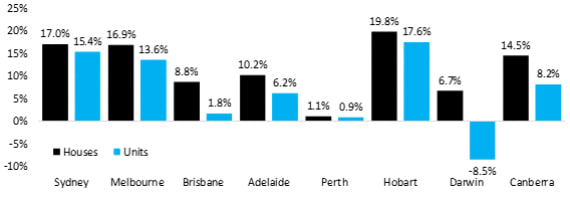
Hobart has recorded the strongest annual growth of all capital cities over the past year and it also has some of the highest rental yields which has meant it has had the strongest total returns. Total returns for houses over the past year have been above 10% in each of Sydney, Melbourne, Adelaide, Hobart and Canberra. For units, double-digit total returns have been achieved over the past year in each of Sydney, Melbourne and Hobart. Units in Darwin were the only capital city property type to achieve negative returns over the past year.
Annual total returns from the housing asset class, individual capital cities, to Aug-17

With capital growth now appearing to have peaked and rental yields at record lows it is reasonable to expect a further moderating of total returns over the coming months.
The other important thing to consider when looking at total returns is the calculation of the rental income. Although rents are increasing in many areas, the assumption in a gross rental yield calculation is that the property is occupied for 52 weeks of the year. In some parts of the country this is increasingly difficult to achieve and it can eat into the investment returns.
The total returns data, particularly for the past decade, shows why housing investment has been so popular and hit record highs.
Returns have been fairly consistent and less volatile than equities however, the ongoing strength and the evidence of a recent slowdown should give investors pause for thought.
With mortgage rates starting to increase for investors, record-high levels of new housing supply and value growth slowing, housing investors shouldn’t assume that the types of returns seen over recent years will continue to be replicated going forward.
Cameron Kusher is research analyst for CoreLogic. You can contact him here.
