National house price drop surpasses 2012 correction: Westpac's Matthew Hassan
EXPERT OBSERVER
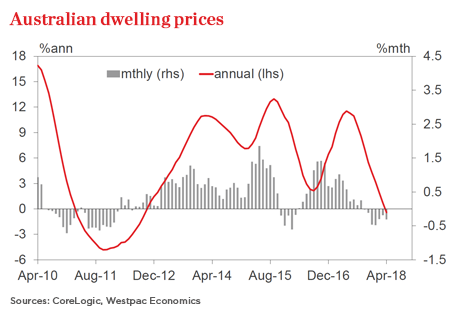
Since the housing market’s September peak, the 2% slip in national prices has surpassed the minor correction in 2015-16 that marred the otherwise multi-year upswing since 2012.
Unsurprisingly, Australia’s long-treasured dinner party conversation topic is starting to generate more nervous chatter.
Firstly, the good news: the rate of decline has moderated a little in the last three months.
The bad?
Buyer sentiment may be showing tentative signs of levelling out but is still not particularly promising, turnover remains near record lows and auction clearance rates are again falling in Sydney and Melbourne.
If it’s any comfort, it’s worth remembering the 2% national decline from the peak remains shallow by historical standards and the declines are narrowly based.
With Sydney leading the decline with a 4.5% fall from the peak, it looks similar to the mid–2000s when the Sydney market experienced a downturn that mostly bypassed other markets, rather than the broader corrections seen during prior major interest rate tightening cycles, such as the mid-1990s.
Click here to enlarge.

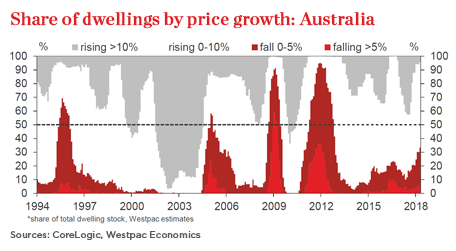
Breaking it down further based on our preferred basis – the CoreLogic hedonic series – shows that a third of all properties are recording annual price declines, with just under 6% recording falls greater than 5%.As our May Housing Pulse report shows, these falls compare to the more substantial house price corrections in 1994–96, 2004, 2008–09 and 2010–12 when more than half of all properties recorded annual price declines.
Conditions across the country of course vary widely.
In NSW, the largest state economy where prices rose the strongest in the recent boom years, slightly more than 25% of properties are now experiencing falls compared to none six months ago, representing the biggest rise in the incidence of price declines since September. What bears watching is whether the price falls spread beyond the middle and “top tier” houses, given several other Sydney segments are on the cusp of declines.
Victoria is performing better. Only one segment – Melbourne “top tier” houses – are recording declines, accounting for 12% of all properties in the state.
Click here to enlarge.

Although not driving the national correction, the mining states are still doing it relatively tough. Nearly 40% of Queensland properties are seeing annual price falls, while in Western Australia the entire state continues to suffer price declines. However, WA’s tentative housing recovery out of the state’s broader recession in recent years looks to be coming through with price slippage moderating and turnover finally lifting.
Elsewhere, trends are mixed as the rising Tasmanian market experiences virtually no housing segments recording price falls and the South Australian market recording a lift in the incidence of price declines since 2017.
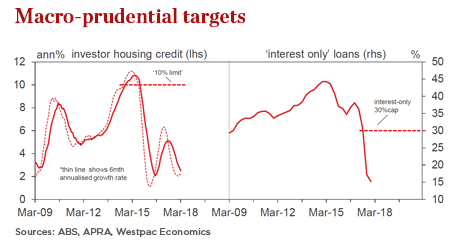
All this feeds into our view that the housing correction is stabilising but susceptible to deteriorating. One thing to watch closely will be the impact of the banking regulator’s prudential policy measures, given the latest guidance points to some further “micro–prudential” tightening in credit conditions in coming months even as some “macro prudential” limits on lending to investors are removed.
Click here to enlarge.

Also, the Reserve Bank estimates that $120 billion of interest only loans are set to roll over to principle and interest terms each year for the next three years. While the RBA suggests this should be a reasonably comfortably transition, there’s the risk of a further weakening in housing markets if it’s not.
More generally, a thin market with low levels of turnover and persistent price slippage is likely to be more susceptible to shocks, buyer sentiment may have improved on a year ago but a loss of confidence from here would be a cause for concern.
The chances of discussion about the housing market dying down at the dinner table and everywhere else any time soon appear very low.
Matthew Hassan is a senior economist at Westpac.
