Counting birds sheds new light on our cities: Kerryn Herman
GUEST OBSERVER
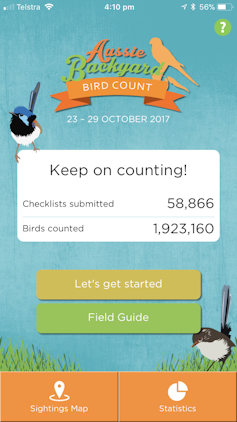
The fourth Aussie Backyard Bird Count has just ended, with nearly 2 million birds from 635 species submitted to the BirdLife Australia app. The count, which is in its fourth year, has created a national database of birds found in our backyards.
We don’t know yet exactly how many people participated this year, but more than 60,000 people submitted checklists in 2016. Participants span the whole country, though participation is highest in our urban areas. By surveying our backyards (rather than “good” bird spots), these citizen scientists provide ecologists – like me – with information from urban areas we would not otherwise sample.
This includes data on a range of common bird species that are not frequently analysed because these species are believed to be secure. One of the most surprising results is a decline in the frequency of occurrence of the laughing kookaburra across southeast Australia.
Counting birds
Everyone has a bird story – and fortunately for ecologists, everyone is willing to share them. With 85% of Australia’s population living in cities and towns, birds are an important connection to our natural environment.
Source: BirdLife Australia
But birds are also good environmental indices. They’re generally easy to measure, they respond quickly to environmental change and we know a reasonable amount about the ecology of most species.
Between 1998 and 2014, BirdLife Australia volunteers collected a significant amount of data. This was used to develop a terrestrial bird index in 2015 – a bird “Dow Jones” to track our biodiversity. It was here that the decline in kookaburras was first identified.
The data were drawn from BirdLife Australia’s ongoing atlas project, now called Birdata. However, there are biases in this data set, as people obviously like to go birdwatching where they will see more birds. This may inflate the frequency of encountering some species and decrease the chances of encountering others – particularly rare and cryptic species.
For the last four years, we’ve asked volunteers to add to this data by counting birds around their home for a week in October, when many birds are highly active and visible. These counts complement the data already available in Birdata by allowing access to backyards across Australia, which are generally poorly represented in the larger data set.
While there are still limitations in the Backyard Bird Count data, such as the risk of mis-identification, for common species like the laughing kookaburra we can generally be confident that the identification is correct. Even if the same bird is counted multiple times, our models report only a species’ presence or absence, so inflated numbers don’t affect the trend.
Are kookaburras really declining?
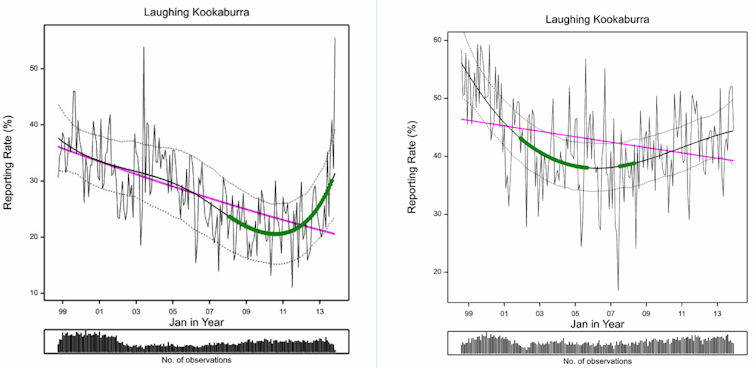
The below figures show modelled trends for the kookaburra across metropolitan Melbourne and Sydney. These figures are derived from the volunteer-collected Birdata, much of which comes from green spaces and remnant vegetation in these landscapes.
I wondered whether these declines are true changes in the populations, or reflect a change in the way kookaburras are using the landscape, possibly moving into the matrix of urban backyards that just don’t get surveyed. Looking solely at the backyard count data, I found similar trends in the reporting rates of kookaburras as those in the models, supporting that this decline is at the population level. What started out in 2014 as a way of engaging the broader community with their birds is now collecting useful ecological data.
Further exploration of the ABBC data across other capital cities found some interesting things. In both Perth and Hobart, where the kookaburra is considered an introduced species, the birds are recorded more frequently than in Melbourne and across the ACT. In Perth, increases in 2016 compared to previous years suggest an increase in the species there.
Modelled trends for Kookaburras from 1998-2014. Source: Unpublished models/K. Herman/BirdLife Australia, Author provided
The figure on the left is for Melbourne, and on the right is for Sydney. The reporting rate shows the percentage of surveys where kookaburras were recorded as present. The thick black line is the modelled trend (with confidence intervals in dashed line), the pink line shows the statistically significant linear trend, the thin black line shows the monthly calculated reporting rate, and the green spots show acceleration (or a favourable change) in the trend. Note that due to modelling method, the ends of figures tend to blow out as there is no data from which to predict trend.
While three years does not make a trend, Aussie Backyard Bird Count data from heavily urbanised areas suggest we are seeing a decline in this iconic species in the eastern capitals. Likely reasons for this are the loss of nesting hollows and possibly reductions in the availability of prey as we increasingly modify our urban landscapes. We don’t really know as this is not an area that has been researched.
We need citizen scientists
Collecting enough data (especially from the backyards of towns and cities) to detect these kinds of changes can be an overwhelming task. This is where citizen science programs like the Aussie Backyard Bird Count can help.
As well as helping ecologists track large-scale biodiversity trends, it also gives people the chance to connect with their natural environment and gain a greater appreciation of our unique fauna.
As with all citizen science projects, there are limitations in the data being collected. However, the Backyard Bird app has been designed to make counting as simple and standardised as possible, providing confidence in the tally of common and “iconic” species, and filling in the gaps found in other data sets.
The good old kookaburra is neither rare or cryptic. If anything, if people are seeking out “good” bird habitat to survey we would expect that kookaburras would be one of those species subject to inflated reporting. But this is not what we encountered.
![]() If we are starting to see declines in species that we have traditionally considered secure, what does this mean for those that are already at risk? Once all the data from the Aussie Backyard Bird Count have been collated and vetted we will continue to explore the developing trends in Australia’s urban birds. Increasing engagement and awareness in our communities can help ensure our backyard birds are still around to count next year.
If we are starting to see declines in species that we have traditionally considered secure, what does this mean for those that are already at risk? Once all the data from the Aussie Backyard Bird Count have been collated and vetted we will continue to explore the developing trends in Australia’s urban birds. Increasing engagement and awareness in our communities can help ensure our backyard birds are still around to count next year.
Kerryn Herman is a research ecologist at Deakin University.
This article was originally published on The Conversation. Read the original article.


