Private renters are doing it tough in outer suburbs of Sydney and Melbourne
EXPERT OBSERVERS
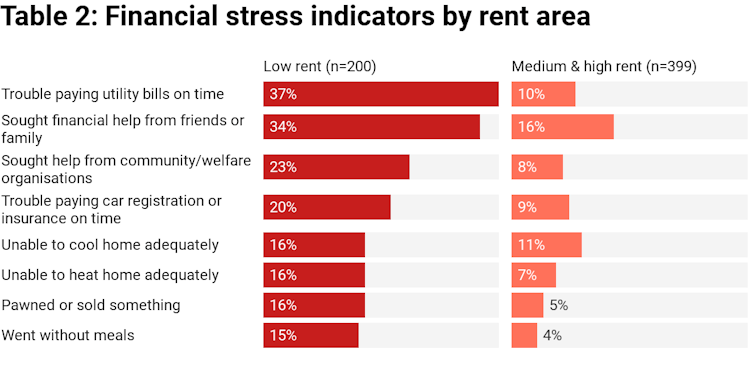
In low-rent outer suburbs, almost one in six households could not afford to keep their house cool and went without meals.
Private renting continues to expand at the expense of home ownership, newly released ABS statistics show. More than one in four Australians (27%) are now tenants of a private landlord (2017-18). Only one in five lived in private rental housing in 1997-98.
Our research looked at private renters in middle and inner suburbs and low-rent outer suburbs (200 private renters in each area, 600 in total) in Sydney and Melbourne. Geographical differences in income sources and deprivation rates might be expected. However, the variations in financial stress revealed by our study were startling. In low-rent outer suburbs, much higher proportions, for example, went without meals or had to pawn or sell something to get by.
Household incomes
Not surprisingly, tenants in the inner/middle suburb areas and the (low-rent) outer areas had a very different profile of income sources, as Table 1 shows.
In areas with medium and high rents, wages or salaries were the main source of income for more than four out of five respondents (83%). In the outer suburban, low-rent areas, this was true for barely half (56%). A third relied mainly on state pensions or benefits.
In more than a quarter of tenant households (28%) in low-rent areas at least one member was an unemployed job-seeker. Only 8% of households in the medium/high-rent areas included an unemployed member.
Finally, once again indicating the typically more deprived situation of the outer suburb group, a much greater proportion of these tenants, 62%, received Commonwealth Rent Assistance compared to 21% in the other areas.
Signs of financial stress
Respondents were asked: “Over the past year, have any of the following happened to you/your household because of a shortage of money?”
We found levels of financial stress varied greatly between areas. Among low-rent (outer suburban) tenants almost two-thirds (63%) experienced at least one of the eight possible financial stress indicators listed in Table 2. That’s twice the proportion for the inner/middle-area cohort (32%).
Benchmarking both of these figures against the nationwide rate of 20% (based on the all-tenure national comparator on the incidence of financial hardship) illustrates the pervasiveness of economic stress among private renters in all areas of our major capital cities. But in outer suburban low-rent areas of Sydney and Melbourne the risk of financial hardship is more than three times the national norm among tenants. Our earlier research also noted this.
Comparing the two tenant groups revealed statistically significant differences on every financial hardship indicator – see Table 2.
Strikingly, almost one in six households living in low-rent areas went without meals. A similar proportion had to pawn or sell something to get by.
One in three tenants in these areas turned to family and friends for financial help. Almost one in four (23%) sought help from a welfare or community organisation.
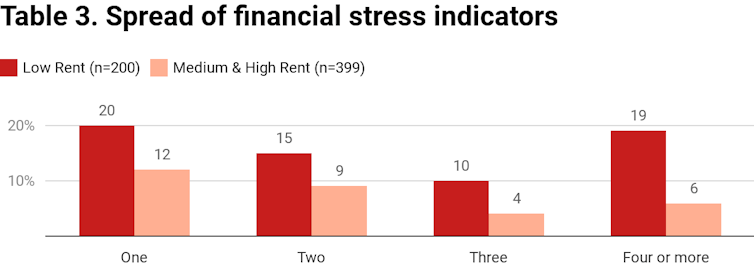
Exposure to multiple forms of financial stress indicators was also much greater in low-rent areas. One in five (19%) tenants here reported enduring four or more financial stress indicators versus 6% in medium/high-rent areas. For households in this position, damaging impacts on their quality of life and probably physical and mental health are likely.
A common theme to financial stress
We found that being reliant on government benefits was associated with multiple indicators of financial stress, irrespective of area. More than one in three (37%) such households experienced four or more of the financial stress indicators. Alarmingly, poverty resulted in 26% of this grouping going without meals in the last year.
Employment status was a significant factor irrespective of area. In households where a household member was either looking for work, out of the workforce or retired, 27% of these households had four or more financial stress indicators. In households where at least one person was employed full-time, only 5% had four or more stress indicators.
The ongoing trend of increasing housing cost pressures on lower-income Australians over the past decade provides the context for the high incidence of financial stress, particularly among tenants in low-rent areas of Sydney and Melbourne. Latest ABS data reveal that, for the least affluent fifth of households, typical spending on housing increased from 23% of income to 29% over that period. In contrast, typical spending on housing by the top fifth was unchanged at 10%.
The case for increasing benefits
Our study brings home that everyday life is an enormous battle on various fronts for many benefit-reliant and other low-income tenants in Sydney and Melbourne. Even if they can find a tenancy in a low-rent area to keep housing costs down, their likelihood of after-housing poverty, including energy poverty, is high.
At the most extreme end of the scale are the one in five tenants in the outer low-rent areas (one in ten across all three areas) who experienced severe financial stress (four or more indicators of financial stress). After paying for their housing, many of them lack money for essentials.
Being located on the urban fringe, and therefore often remote from services and/or employment, compounds such hardship. Not surprisingly, the incidence of financial stress is highest among government benefit recipients. This finding highlights the urgent need to increase Commonwealth Rent Assistance to offset some of their housing costs, and also to increase key income support payments, such as Newstart and the Disability Support Pension.![]()
Alan Morris, Research Professor, University of Technology Sydney; Hal Pawson, Associate Director - City Futures - Urban Policy and Strategy, City Futures Research Centre, Housing Policy and Practice, UNSW; Kath Hulse, Research Professor, Centre for Urban Transitions, Swinburne University of Technology, and Violet Xia, Research Associate, University of Technology Sydney
This article is republished from The Conversation under a Creative Commons license. Read the original article.


