Where are the most disadvantaged parts of Australia? New research shows it's not just income that matters
EXPERT OBSERVER
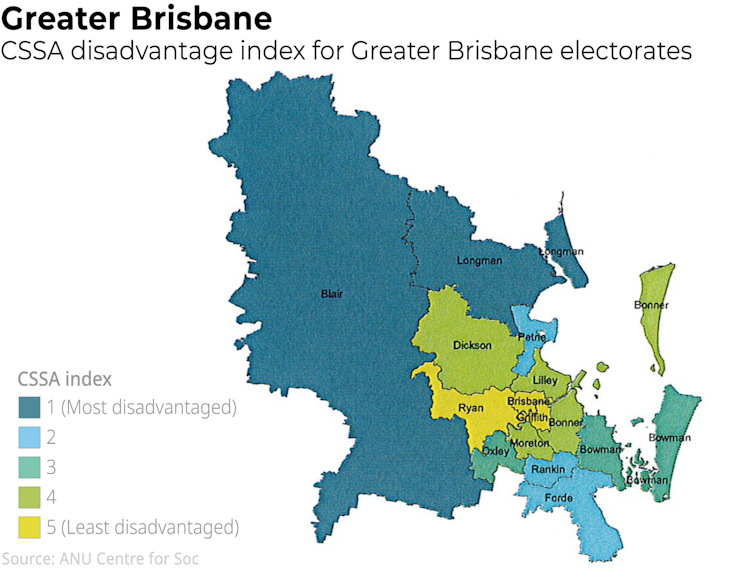
New research on disadvantage in Australia has found the gap between rich and poor is very wide in Sydney, while much of Queensland struggles with educational disadvantage and regional NSW and Victoria are both more disadvantaged when it comes to health.
Previous research on poverty has placed a heavy emphasis on income and economic outcomes at a given point in time. But disadvantage often goes beyond just economic factors. It’s also necessary to analyse the educational, health and social inequities in society to get a more accurate understanding of disadvantage.
At the core of our new research, published in our Mapping the Potential report, is the idea that disadvantage in Australia is more varied and complex than many people may think.
How we conducted our research
This research, conducted by the ANU Centre for Social Research and Methods and commissioned by Catholic Social Services Australia, expands on the socioeconomic indexes produced by the Australian Bureau of Statistics by adding more detailed variables across health, education, social and economic domains.
We also incorporated a “persistence” element to disadvantage – in that, disadvantage isn’t tied to a singular point in time, but persists for a longer period.
In our research, disadvantage was data-driven. And to quantify disadvantage, we chose variables that were generally considered relevant for each area. For economic disadvantage, for instance, we looked at low incomes, low-skilled jobs and unemployment. Areas with a large share of people with these characteristics tended to be more disadvantaged.
Health disadvantage was based on various chronic health conditions, such as diabetes, heart and circulatory conditions, and obesity.
Educational disadvantage focused on levels of educational attainment and child educational disadvantage - both cognitive and physical development. We used data from the Australian Educational Development Census to gauge this.
Social disadvantage was less clearly defined. We focused on variables that contribute to social capital, or the interpersonal networks that help a society function effectively. Regions with social disadvantage, for example, tended to have low rates of volunteering, internet connection and social cohesion.
Geographically, we analysed these variables at the SA2 level (areas comprised roughly of suburbs and towns) across Australia. We then aggregated the results to the federal electorate level to avoid singling out and possibly stigmatising individual suburbs.
For comparison purposes, each index was standardised to an average score of 1,000 across all SA2s. Nearly all SA2s (95%) had a score between 800 (high disadvantaged) and 1,200 (low disadvantage).
The Conversation, CC BY-ND
To better understand differences between our major populations, we further aggregated our results to nine larger geographic entities: the five major capitals, the regional areas of NSW, Queensland and Victoria and a “catch all” remainder of Australia region. This last grouping was used due to the small number of electorates in some states and territories.
The most disadvantaged parts of Australia
The key finding of the report is there is considerable variation in the types of disadvantage experienced across Australia. Moreover, the types of disadvantage varied between locations, as well.
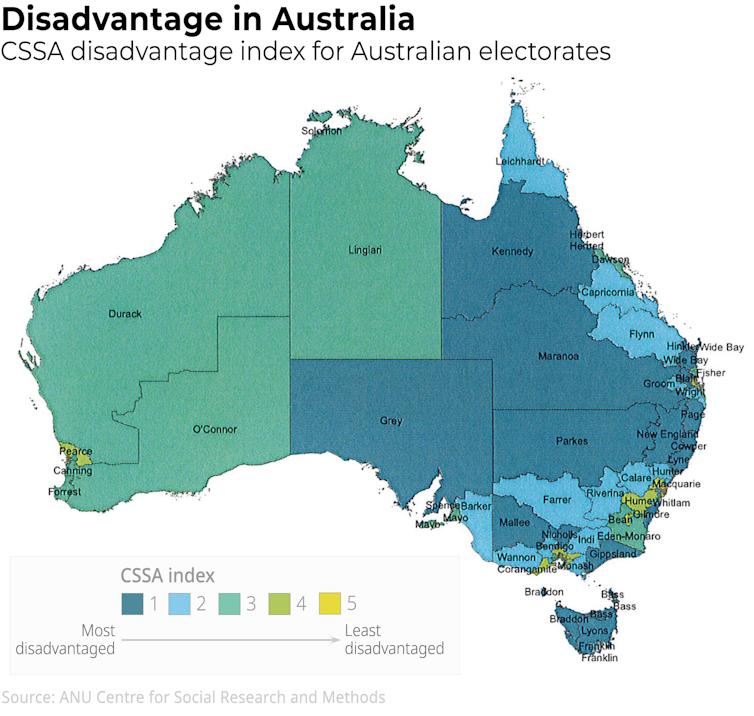
Australia’s most disadvantaged electorate overall was Hinkler in regional Queensland. Hinkler ranks poorly in three of the disadvantage domains we tracked: health, economic and social.
Australia’s least disadvantaged electorate is North Sydney.
The Conversation, CC BY-ND
The Conversation, CC BY-ND
When we looked at each type of disadvantage individually, we found that electorates had very different needs.
From an economic perspective, for example, our most disadvantaged electorate is Blaxland in Western Sydney. Our most disadvantaged health electorate is Braddon in regional Tasmania.
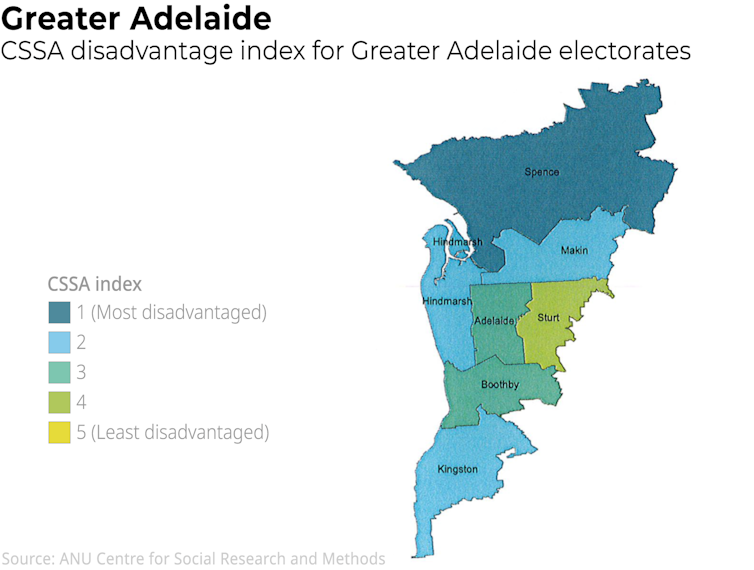
The most disadvantaged educationally was Spence in the northern suburbs of Adelaide. Socially, the most disadvantaged electorate was Parkes in regional NSW.
The Conversation, CC BY-ND
The Conversation, CC BY-ND
The Conversation, CC BY-ND
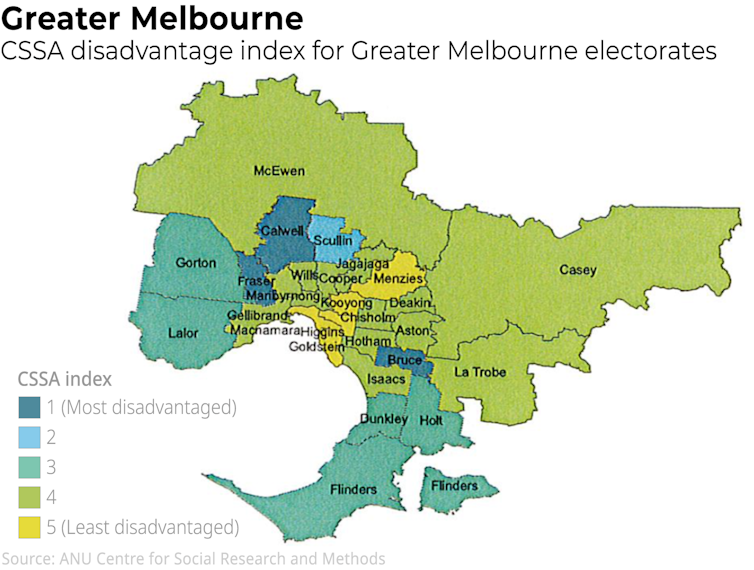
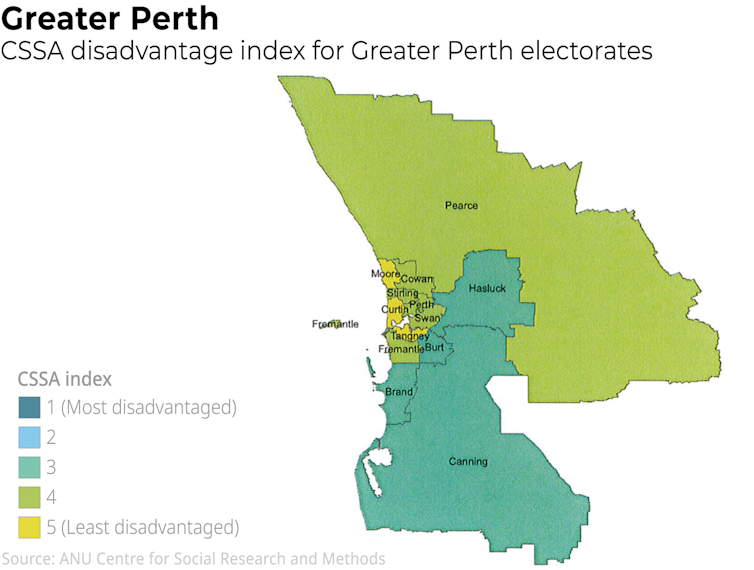
When comparing the larger regions in our report, we found Adelaide faces the most disadvantage overall, while Sydney and Perth have, on average, the least overall disadvantage.
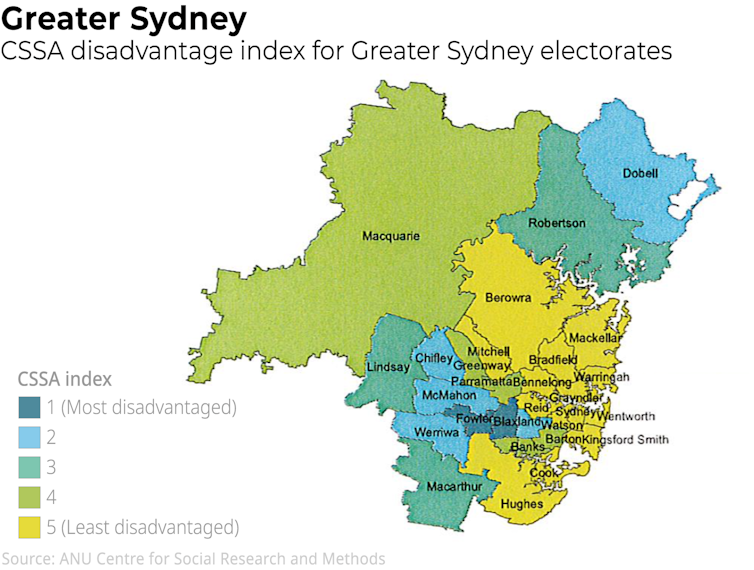
Even the best-performing regions have pockets of high disadvantage. For example, while Sydney has a relatively strong overall result, it also has the most economically disadvantaged electorate in Australia (Blaxland) and several suburbs with scores below 800.
The research also shows the vast disparities between urban and regional areas in Australia. For example, according to our data, nearly the whole of regional NSW is considered disadvantaged. In contrast, the inner suburbs of Sydney are much better-off.
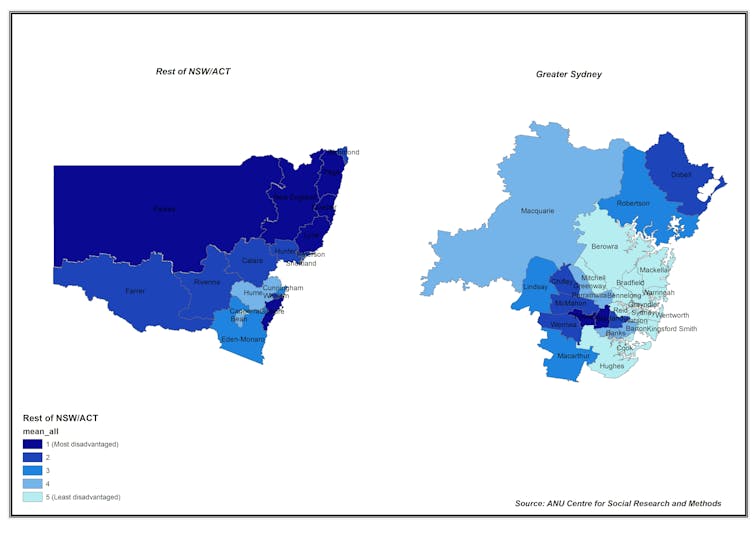
Differences in disadvantage between regional NSW and greater Sydney.
Most concerning was the deep level of disadvantage found in predominantly Indigenous communities, mostly in the Northern Territory. The electorate of Lingiari, for instance, has a marked split between the relatively advantaged suburbs around Darwin and the deeply disadvantaged areas outside the city.
We also found a number of electorates in coastal NSW, Queensland and Tasmania with significant health disadvantage. This is concerning given the threat of future outbreaks of COVID-19.
Why this data matters
The indexes remind us that despite nearly 30 years of continued economic growth in Australia, prosperity has not come to all parts of the country. Nor is economic advantage necessarily an indication of other facets of well-being, such as educational or health equality.
This data is important because it can help non-profit organisations make better-informed decisions on where and how to allocate future resources and investments.
It will also help governments at all levels gain a deeper understanding of the types of disadvantage that exist within regions and how their programs and other methods of assistance – both financial or non-financial – can be most effective.
Ben Phillips, Associate Professor, Centre for Social Research and Methods, Director, Centre for Economic Policy Research (CEPR), Australian National University and Brenton Prosser, Professor, University of Canberra
This article is republished from The Conversation under a Creative Commons license. Read the original article.

