Sydney lockout laws review highlights vital role of transparent data analysis
EXPERT OBSERVER
The New South Wales Bureau of Crime Statistics and Research (BOCSAR) recently claimed Sydney’s alcohol licensing regulations, commonly known as lockout laws, reduced non-domestic assaults by 13% in the CBD.
Its calculation relied on a decision to allocate 1,837 of these offences to both Kings Cross and the CBD – that is, double-counting the data.
Our analysis found this decision was critical to the conclusion that assaults decreased in the CBD. For every other choice about the areas to which offences data were allocated and type of analysis we found no decrease.

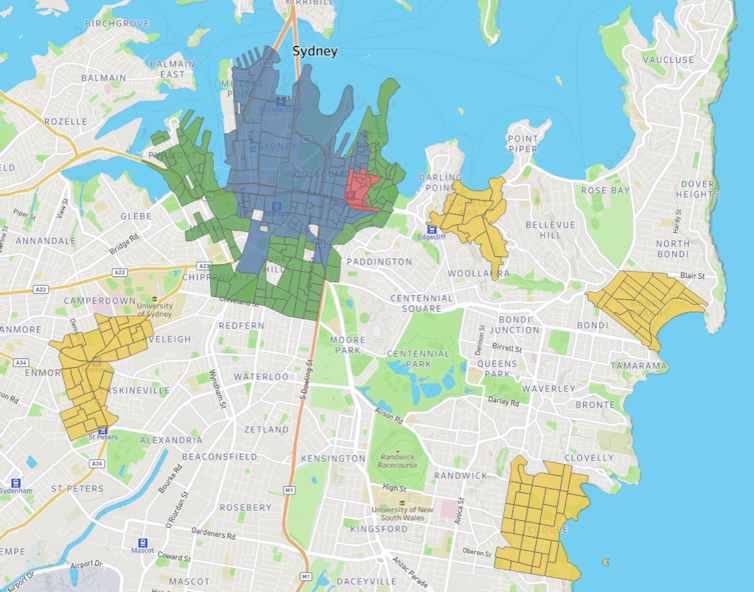
Map of Sydney and the entertainment precincts as used by BOCSAR in its analysis: blue – CBD entertainment precinct; red – Kings Cross entertainment precinct; green – nearby displacement areas; yellow – outer displacement areas.
Our findings highlight an important question: how do the choices of data collection, pre-processing and analysis affect policy decisions?
The allocation of crimes to areas is just one of several choices made when using data to assess policy impacts. Other choices include how to measure violent crime, what time period to consider and the geographical extent of the areas to include. The question is: if other choices were made, would the results affect a decision to repeal or continue the laws?
Our findings point to the need to follow a couple of principles when using data to inform policymaking. First, the institution that collects data and the institution that analyses the data should be independent of each other. Second, we need as much transparency about the data and its analysis as possible.
So what exactly did the analyses show?
BOCSAR chose to use monthly non-domestic assaults from 2009 onwards. There is nothing wrong with these choices, but others could have been made.
For instance, why from 2009 onwards, not from 2005? Why monthly, not daily? Why reported non-domestic assaults, not reported assaults causing grievous bodily harm? Why divide the area into the CBD and Kings Cross only?
One way of assessing the impact of such choices is to use different subsets of data, different types of data pre-processing and different statistical and/or machine-learning techniques. If the conclusion still remains the same, then our decision is robust to this source of variability. If not, we need to understand why.
For the Kings Cross precinct, the analysis by the Centre for Translational Data Science at the University of Sydney showed the conclusion remained unchanged irrespective of the frequency and period over which data were collected and the analysis performed. Non-domestic assaults had declined following the introduction of the lockout laws in 2014.
For the CBD the reverse was true. Only if we make exactly the same choices as BOCSAR, in particular allocating 1,837 crimes to both the CBD and King Cross, could we conclude non-domestic assaults had decreased very slightly.
Under all other variations of the analyses, including data, methodology and spatial allocation of that data, we found no decrease. Non-domestic assaults in the CBD had been decreasing since 2008 and, if anything, more slowly after the lockout laws took effect.
So why was the inclusion of 1,837 crimes so critical to the conclusions about the CBD?
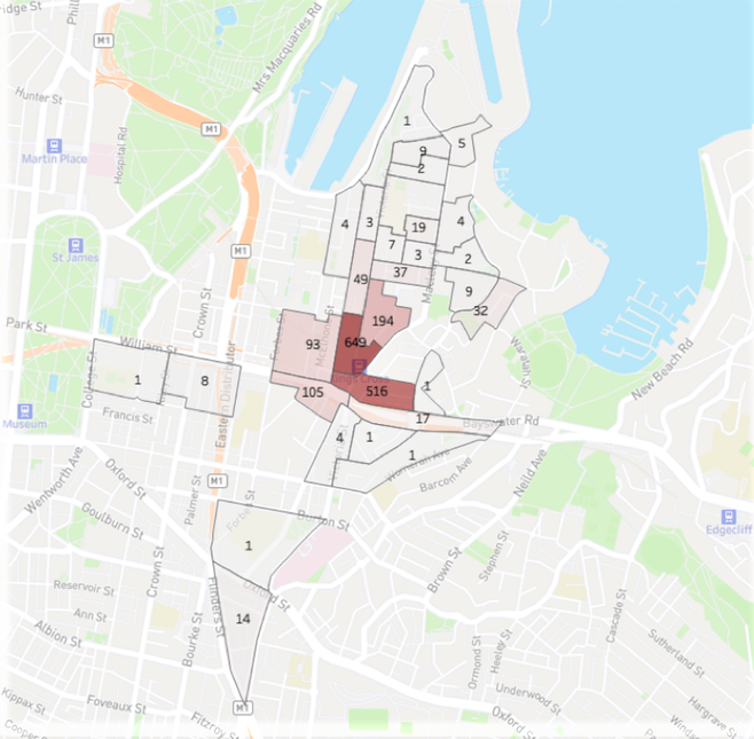
Using data provided by BOCSAR, we plotted the most likely location of those 1,837 crimes. Figure 1 shows these crimes occurred mainly in Kings Cross, an area in which the crime rate had fallen since 2014. We say “most likely location” because we have yet to receive the additional data we requested from BOCSAR to help us locate exactly where these crimes occurred.

Counts of crimes (per SA1 region) that were assigned to both the CBD and Kings Cross. Centre for Translational Data Science, Author provided
With the removal of those 1,837 crimes from the CBD, we detected no decrease in non-domestic assaults. But BOCSAR apparently did. After removing those crimes from the CBD, BOCSAR released an updated report to a parliamentary inquiry into Sydney’s night-time economy. This report claimed assaults in the CBD decreased by 4% (much less than the original 13%).
The committee then asked for our comments. We found the report did not provide a confidence interval for this decrease. Yet the report made a virtue of reporting uncertainty estimates for other quantities and elsewhere it claimed “statistically significant” results.
We replicated BOCSAR’s analysis and found the change in crime could have been as low as a 12% decrease and as high as a 6% increase. In other words, the result is “statistically insignificant”.
What are the implications for making policy?
Why does this matter? There are two reasons.
First, the danger in not explaining, quantifying and reporting uncertainty is that the public loses trust in data-driven policymaking. Only if conclusions acknowledge and explain the uncertainty inherent in inferring complex quantities from data can we make robust and explainable policy decisions that build trust with the public.
Second, if we don’t accept and report uncertainty we could stop looking for other explanations. We might then fail to achieve an outcome that everyone wants: a reduction in violence and a healthy night-time economy.
How do we proceed from here? We’d make two recommendations:
The institution that collects and curates the data should be distinct, informed but independent from the institution/s that analyse the data.
There should be as much data transparency as possible, which would enable different groups to perform different types of analyses, using different sources of data.
We are almost certain these different groups would produce different findings, but the subsequent discussion could provide insights that move us closer to more robust and acceptable policy decisions.
To quote Nobel Prize-winning physicist Richard Feynman:
If we will only allow that, as we progress, we remain unsure, we will leave opportunities for alternatives … to make progress, one must leave the door to the unknown ajar.
The parliamentary committee’s recommendation that BOCSAR and the Centre for Translational Data Science work together more closely appears to do just that. We look forward to an ongoing collaboration to further our understanding of the drivers of violent crime.![]()
Sally Cripps, Professor of Statistics, Director of Centre for Translational Data Science, University of Sydney and Roman Marchant, Senior research fellow and lecturer, University of Sydney
This article is republished from The Conversation under a Creative Commons license. Read the original article.
